Training about the basic properties of the Ionosphere as seen on the ionograms
The Ionosphere
The ionosphere is defined as the ionised part of the upper atmosphere (60-2000 km approximately). As it contains a significant number of free electrons it has an important influence on the propagation of radio-electric signals (Figure 1). The ionosphere is a tool for ground-based radio-communication systems, but it is a noise for space-ground radio-communications systems. The ionosphere is a complex dynamic interface between the outer plasma space and the neutral atmosphere. It is affected both from above, from the direction of outer space (mainly related to solar activity), and from below, from the neutral atmosphere (e.g., intense tropospheric events: cold fronts, thunderstorms).
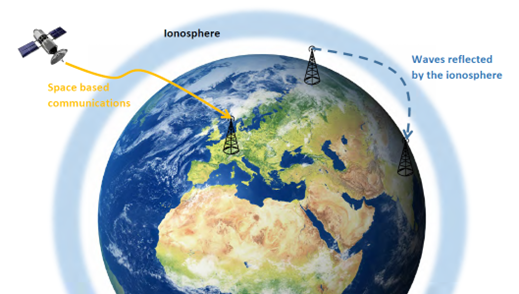
Figure 1. General picture about the ionosphere as part of the Earth upper atmosphere and the transmitted, reflected signals.
Monitoring of the ionosphere
Ground-based observations of the ionosphere are carried out using so-called ionosondes, which can be used to observe the electron density of individual layers as a function of altitude. The measurements are made by emitting short-time radio pulses, usually between 1 and 12 MHz. At a given frequency, the signal will be reflected at the height where the plasma frequency of the ionosphere is equal to the frequency of the probing electromagnetic wave (Figure 2). By measuring the time between the emission of the pulse and its receiving, we can estimate the height at which the reflection occurred, assuming that the signal propagates at the speed of light. By repeating this mechanism at different frequencies, the measurement results in the so-called ionogram (Figure 3), where the plasma frequency as a function of height is shown, can be used to determine the electron density profile (Figures 2 & 3) using formula [1]:
ωpl = (4 . π . ne . e2 / m*)1/2 [1],
where ωpl is the plasma frequency, ne is the electron density, e is the electric charge and m* is the mass of the electron.
The ionogram shows the ionospheric layers, as the E layer with lower electron density and above it the higher electron density F layer, which splits into F1 and F2 layers during daytime. Since the ionosphere is a dispersive medium, the incoming electromagnetic waves split into ordinary and extraordinary modes, which are shown in separate colours (red and green) on the ionograms (Figure 3). Nevertheless, the Digisondes – a special type of ionosonde developed by the Lowell Digisonde International (LDI) – provide even more information about the ionosphere. At the headlines (blue rectangle) there is information about the place and time of the record, the critical frequencies of the ionospheric layers (maximum frequency reflected from a given layers, which relates to the maximum electron density of the layer, red rectangle), virtual heights of the layers (green rectangle). Automatically calculated electron density profiles are also obtained by the Digisondes, the parameters of the profile are shown in the purple rectangle. Furthermore, the maximum usable frequencies for a given distance, which frequency is ideal to transmit a HF signal to the given distance, are also estimated (orange rectangle).
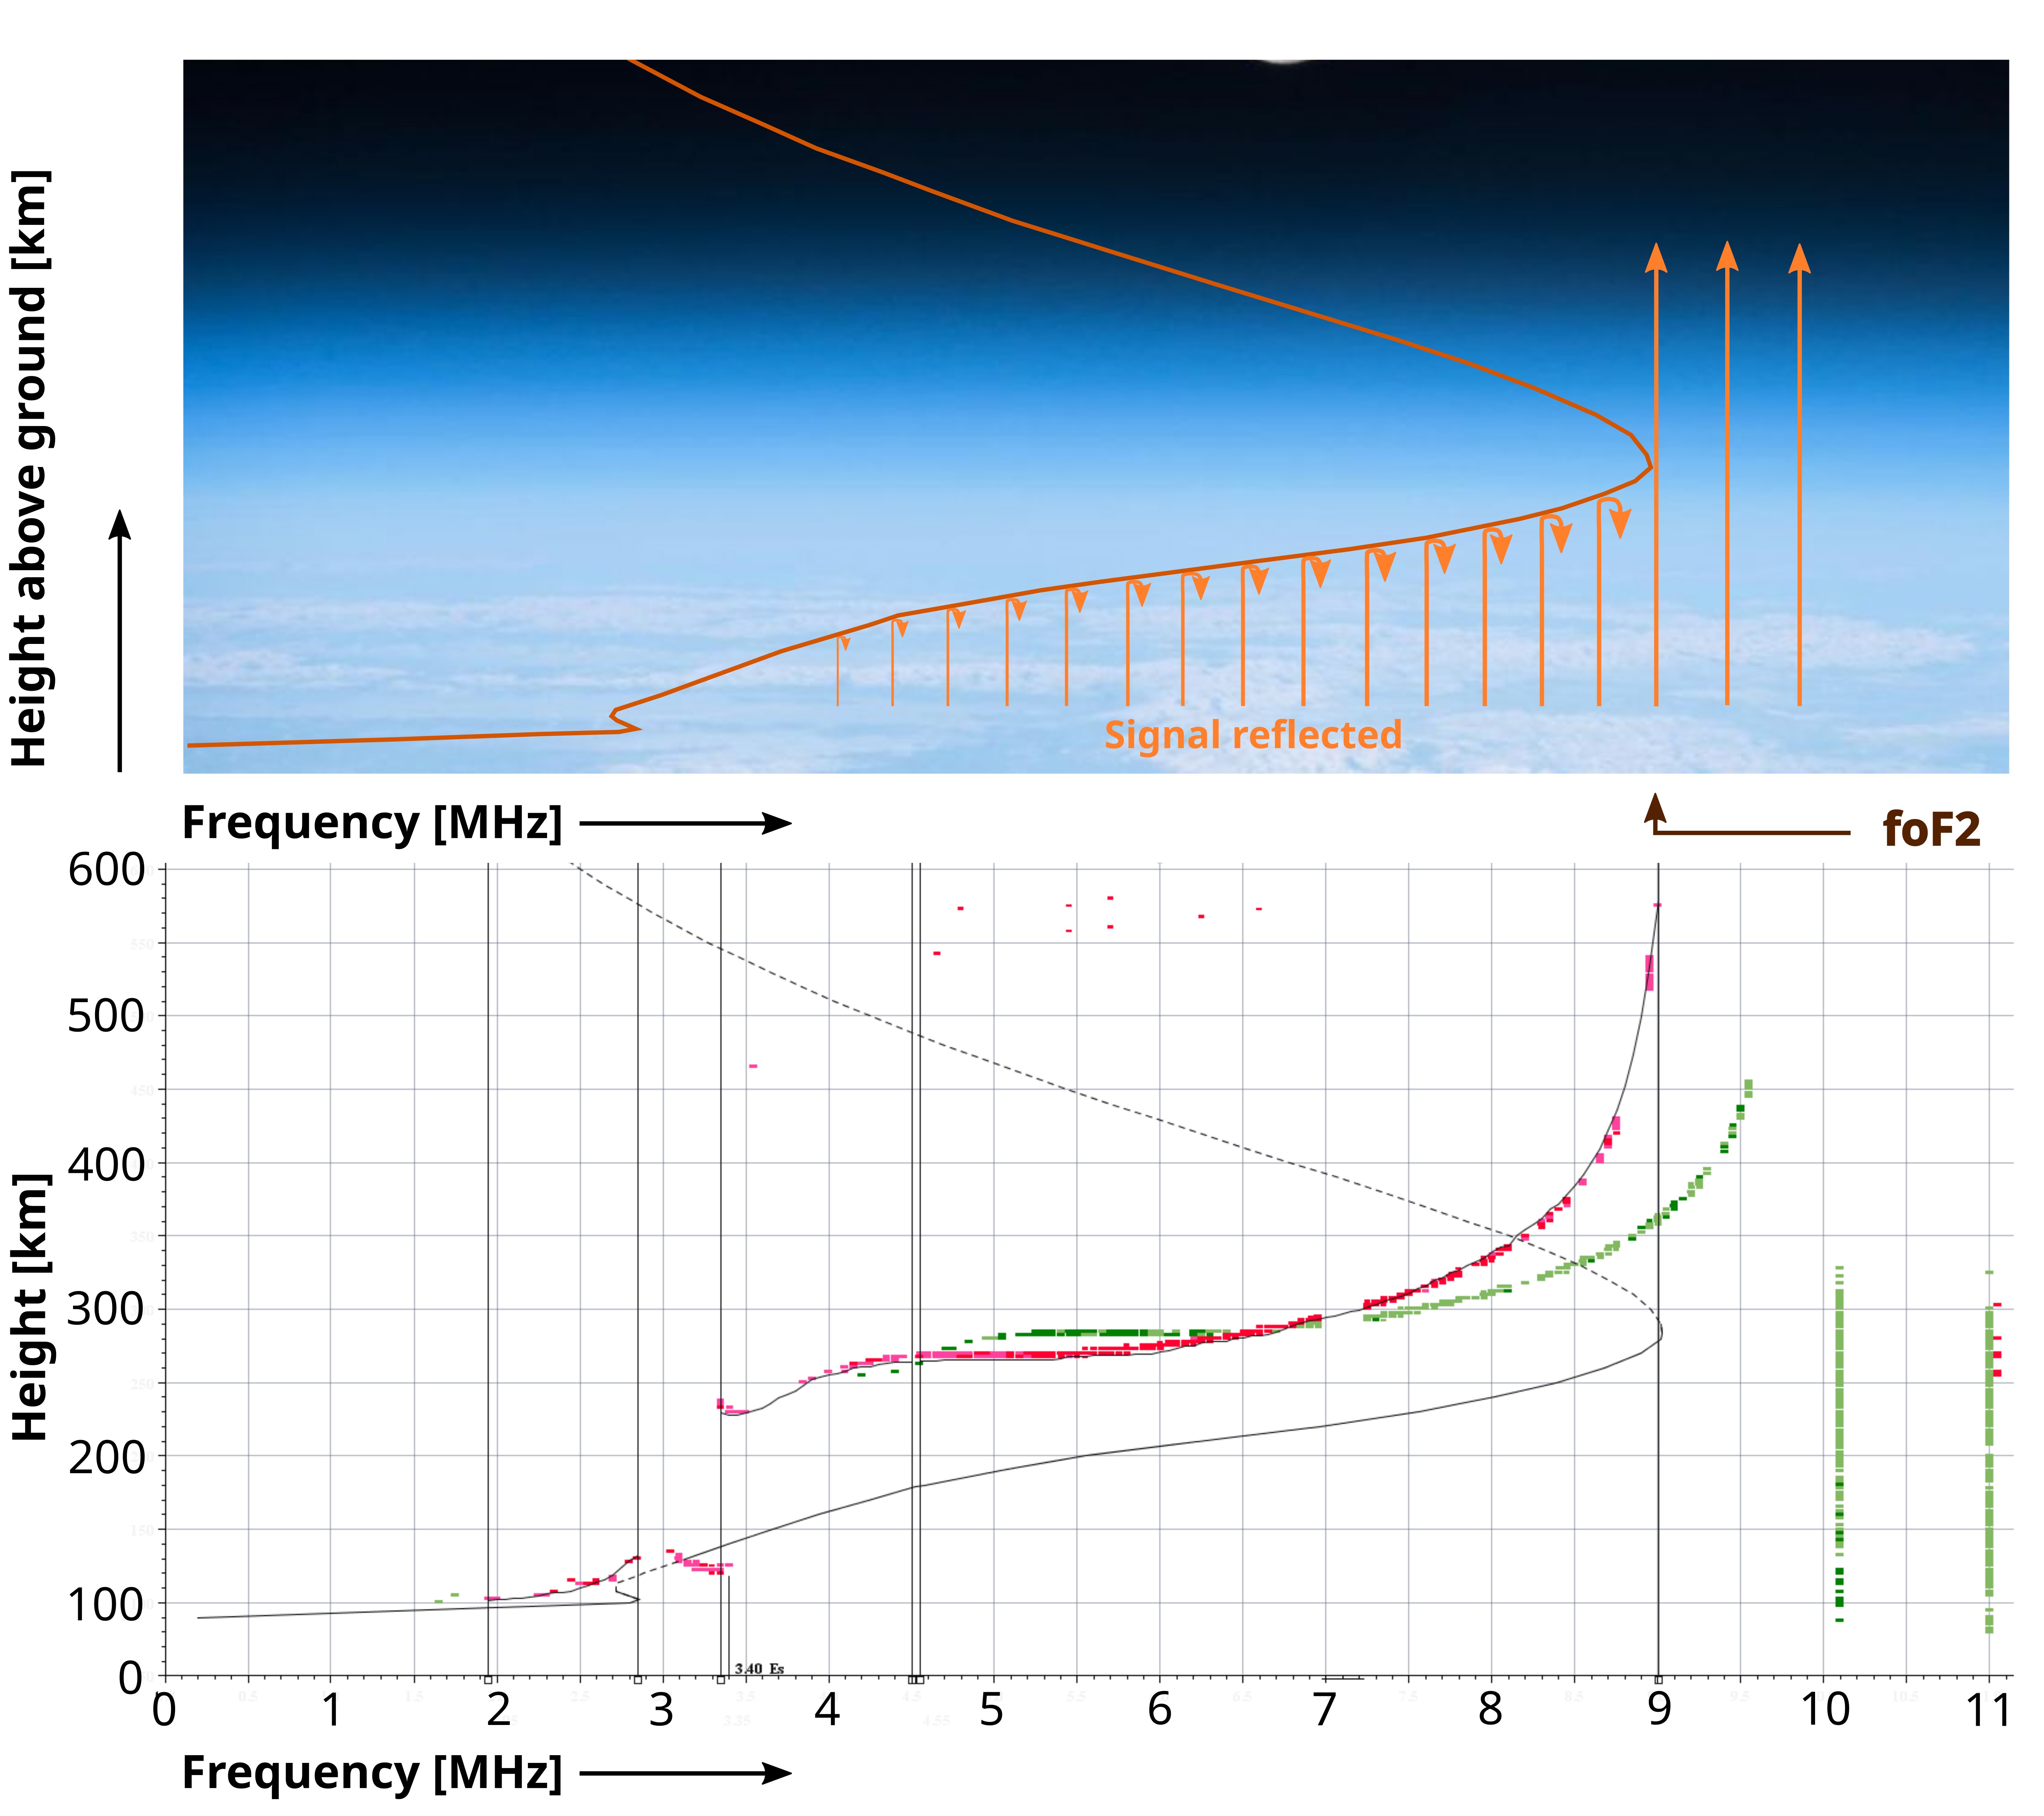
Figure 2. Schematic of the ionosopheric sounding (upper plot). A sample for the ionogram aith the ordinary (red) and extraordinary (green) mode (lower plot). The indicated foF2 parameter is the critical frequency of the F2 layer and it relates to the maximum electron density of the layer. Above this frequency the emitted radio signals go through the ionosphere.
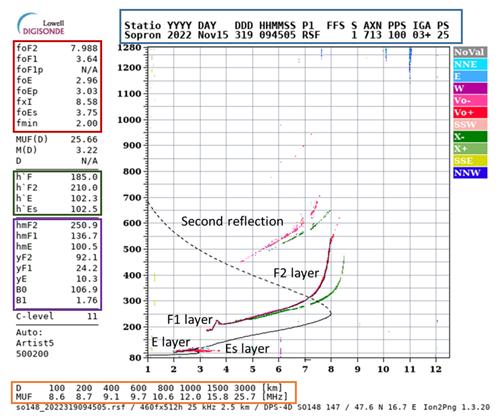
Figure 3. An ionogram measured by the DPS4D Digisonde at Sopron at 09:45 UTC on 25 November, 2022. The headlines (blue rectangle) contain information about the place and time of the record. The list of the critical frequencies and the virtual height of the layers are shown in the red and green rectangles. While the parameters of the calculated electron density profile and the maximum usable frequencies related to different distance are shown in the purple and orange rectangles respectively.
Night versus Day
The main mechanism sustaining the ionosphere is the photoionization caused by the Sun. Ultraviolet (UV), X-ray and shorter wavelengths of solar radiation are absorbed by the neutral gas of the atmosphere. A portion of energy of the photons is used to dislodge an electron from an atom or molecule forming a pair of charged species—an electron, which is negatively charged, and a companion positive ion. The reverse process of ionization is recombination, in which a free electron is "captured" by a positive ion. The balance between these two processes determines the extent of ionization. Therefore, the ionosphere is very different on the sunlit hemisphere of the Earth, and in the night side.
At night the F region is the only persisted layer of the ionosphere with significant ionization, the electron density in the E and D region is extremely low. On the contrary, the D and E regions become much more ionized during the day. Moreover the F region splits into F1 and F2 layer (Figure 4). The F2 layer persists by day and night, thus it plays the most important role in the refraction and reflection of radio waves. This diurnal difference is also reflected on the ionograms measured by the ionosondes. Generally, during the daytime the E region and the F1 and F2 layers are clearly visible, while only the F2 layer persists for the night. Furthermore, the value of the maximum plasma frequency of the F2 layer (foF2 parameters) is larger during the day (Figure 5).
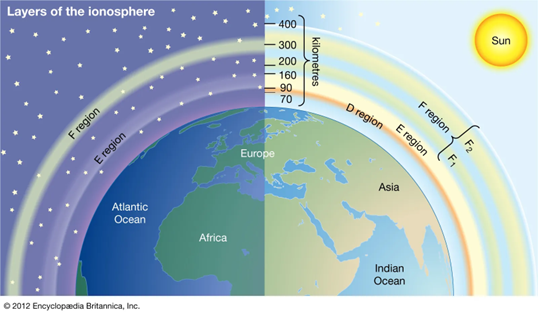
Figure 4. The regions of the ionosphere during the night and the day (source of the figure: Encyclopedia Britannica, Inc. https://www.britannica.com/science/ionosphere-and-magnetosphere).
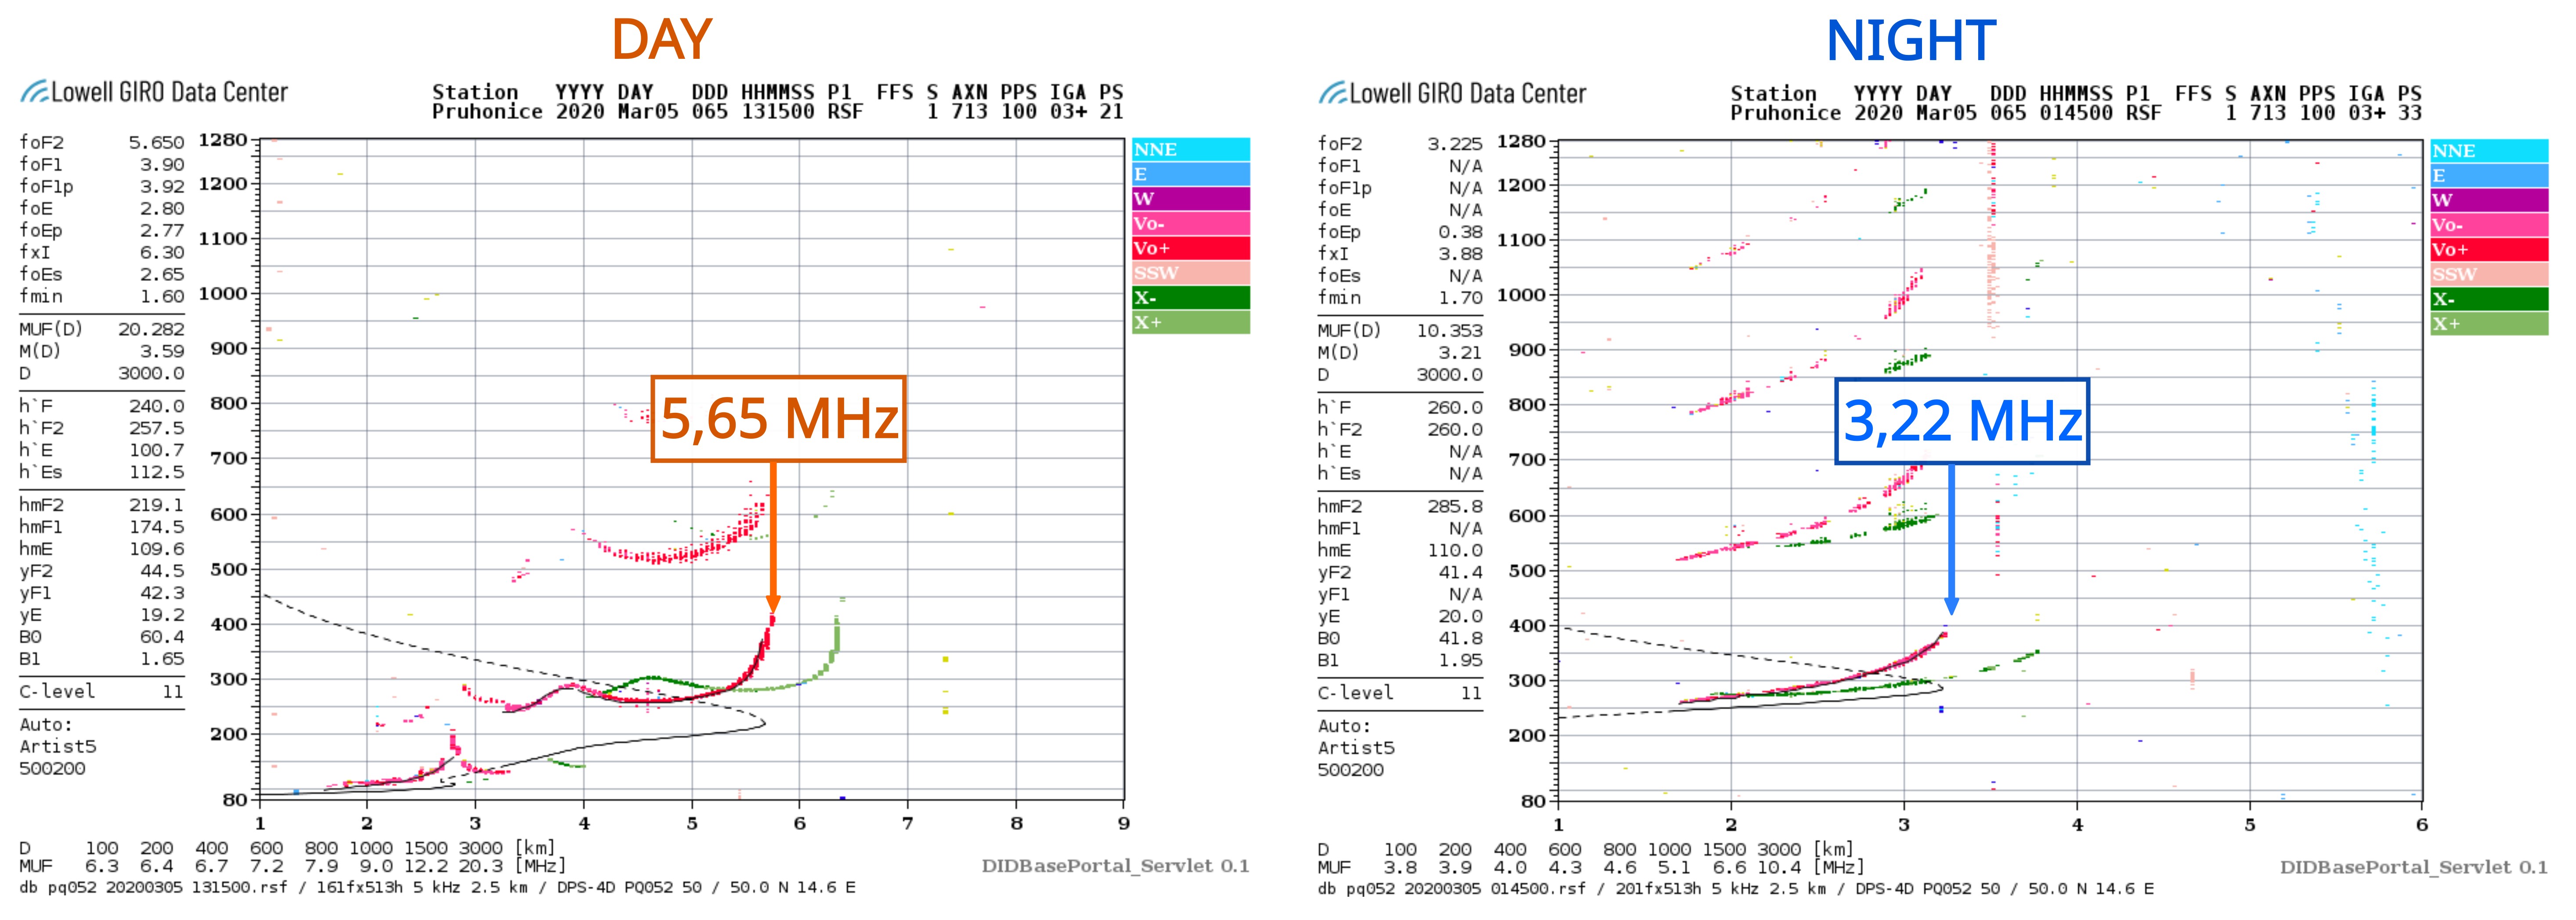
Figure 5. Typical daytime and nighttime ionograms. The highest plasma frequency of the F2 layers (foF2) parameter is indicated by the blue arrows and its value are in the blue boxes.
Seasonal and Solar Cycle dependence
Since the ionization depends primarily on the solar irradiance beside the diurnal variation there is also a seasonal and a 11-year solar cycle dependence. There is less ionizing solar radiation during the local winter since that hemisphere is tipped away from the Sun then. Furthermore, when there are more active regions on the Sun during the solar maximum it means an increased number of the source of coronal heating and accompanying increases in EUV and X-ray irradiance. Moreover, the number of solar flares and accompanying energetic particle events are also increased leading to further ionization in the sunlit hemisphere and at the Polar Regions. Therefore, the degree of ionization in the ionosphere follows the 11-year solar cycle.
These difference can be also recognized on the ionograms, the value of the foF2 is higher during the high solar activity compared to the low one at daytime and nighttime, too (Figure 6). Comparing the solar activity variation (as indicated by the sunspot number) with the foF2 parameters measured at Athens the relationship between the two variables is clearly seen (Figure 7). The foF2 parameter show larger values in the periods when the sunspot number is also higher.
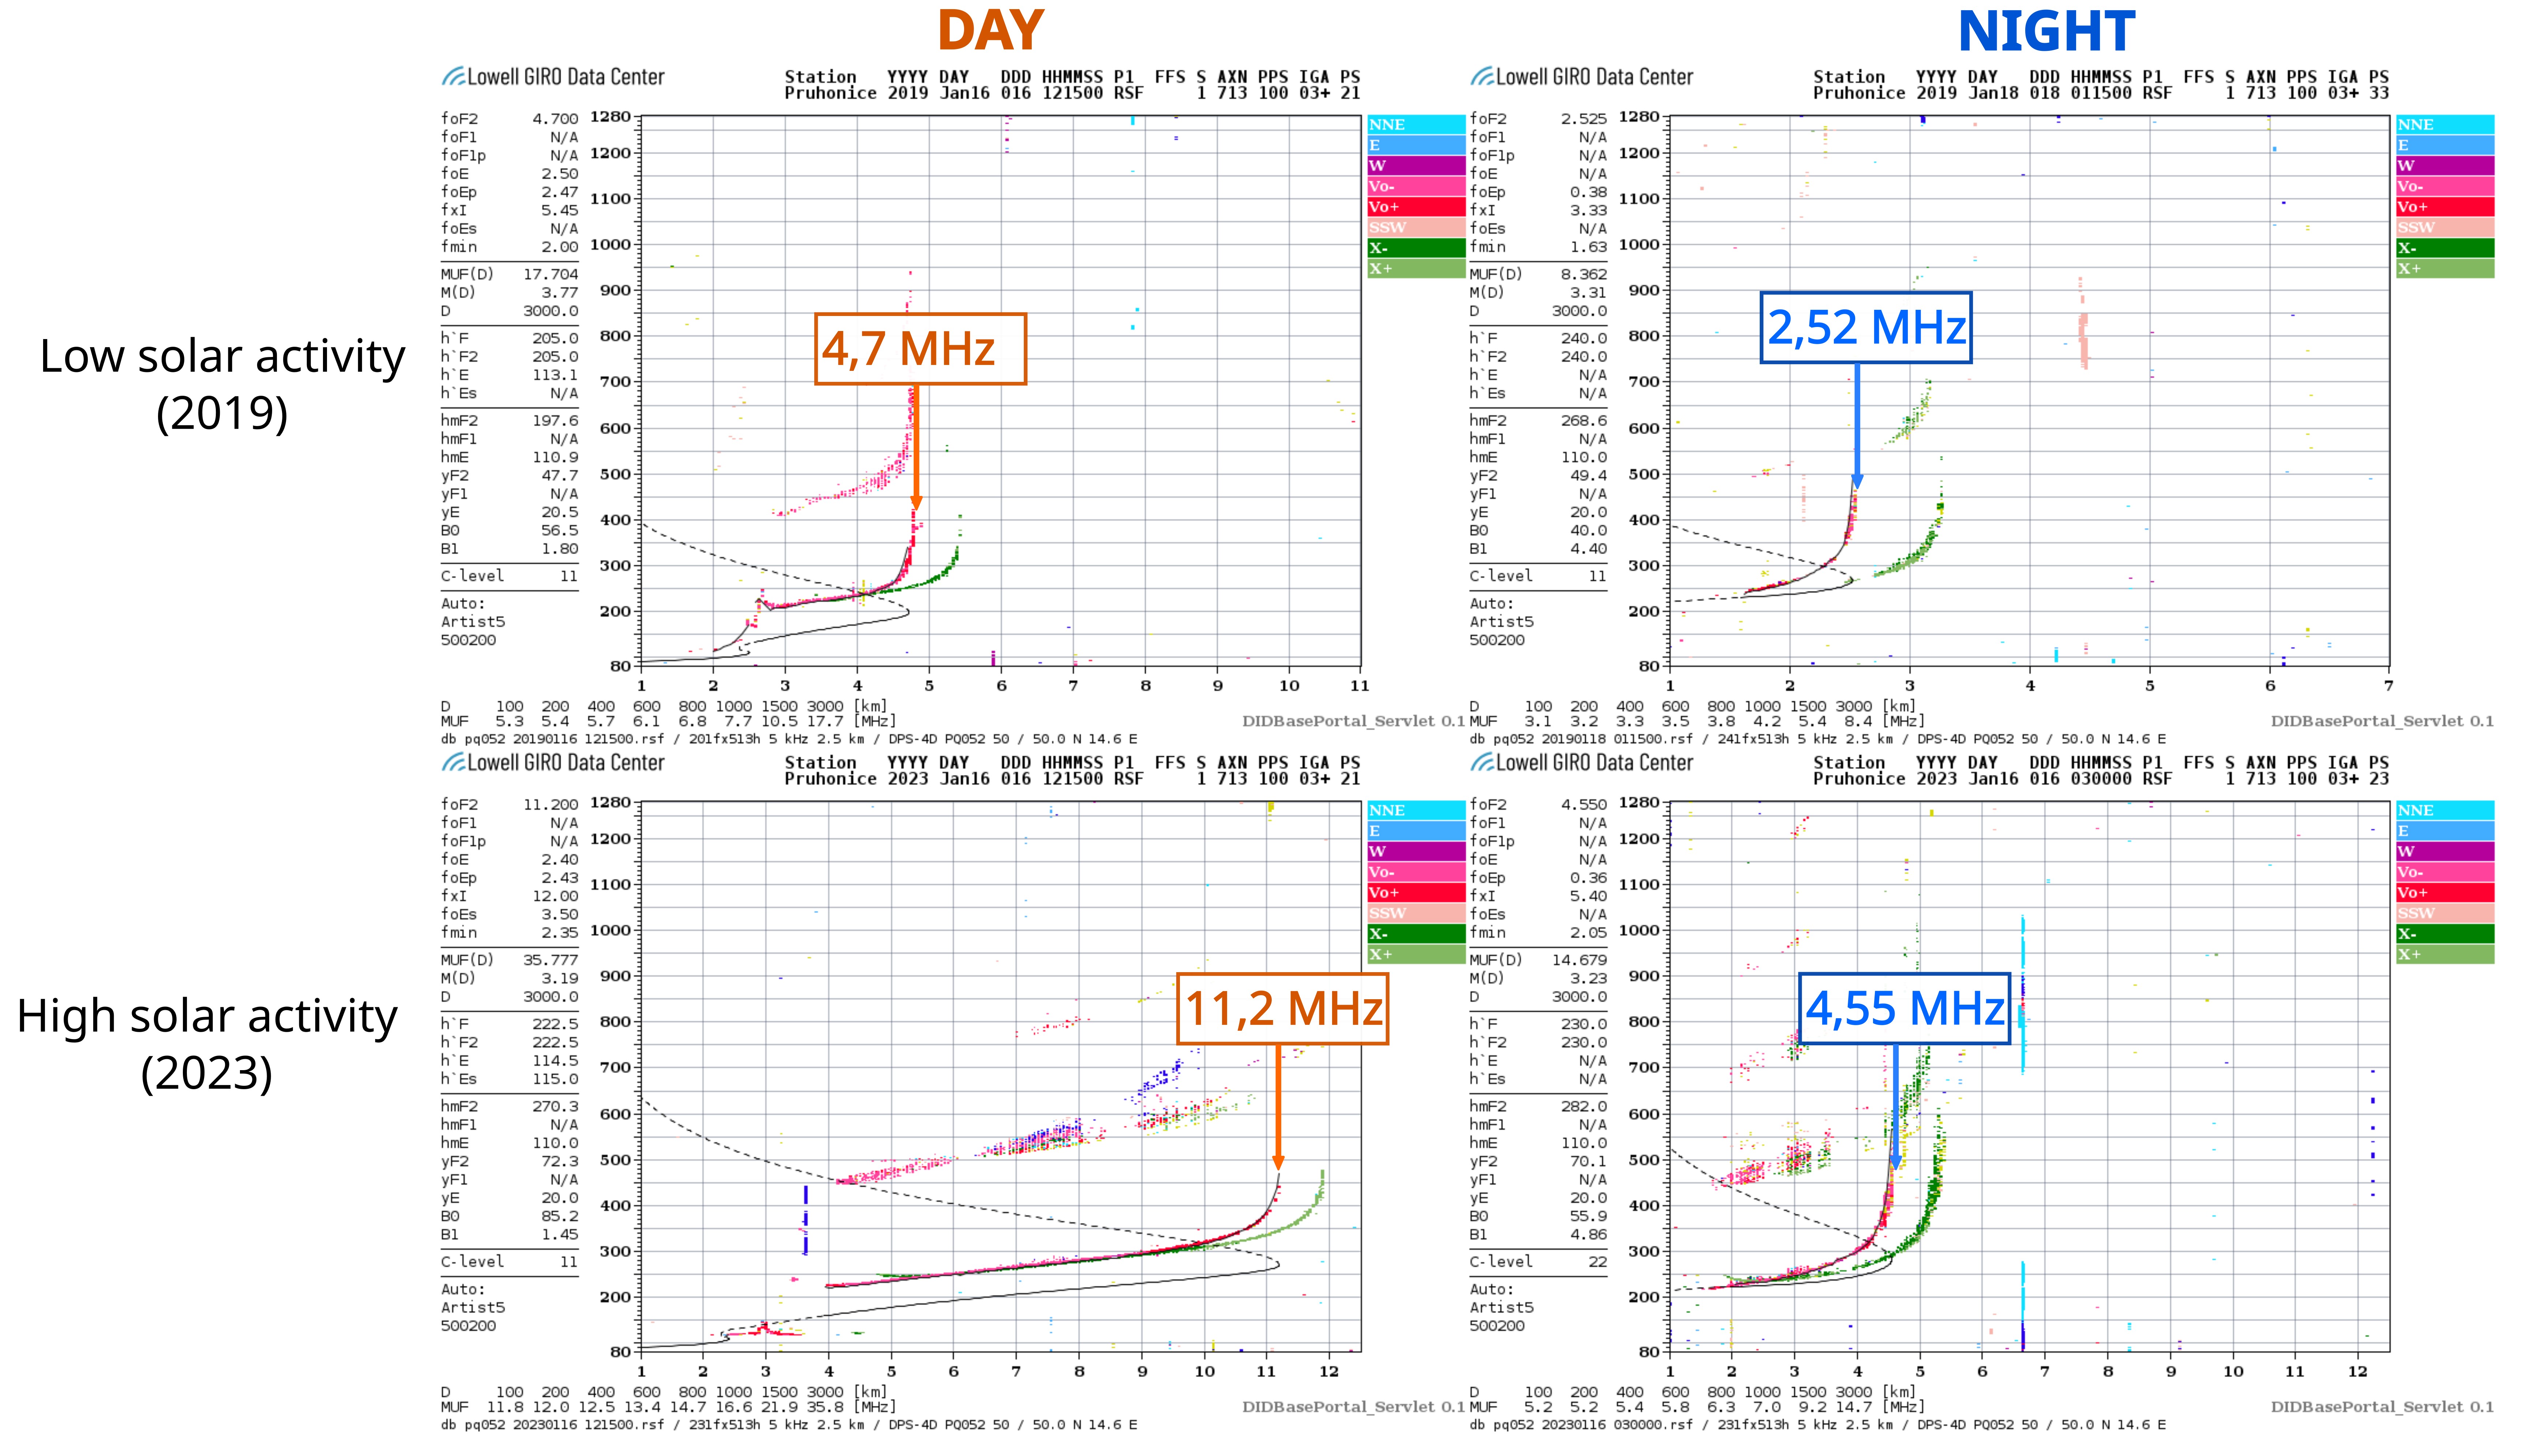
Figure 6. Ionograms recorded at Pruhonice during low and high solar activity around noon and after midnight. The foF2 parameter is indicated by the blue arrows and its value are in the blue boxes.
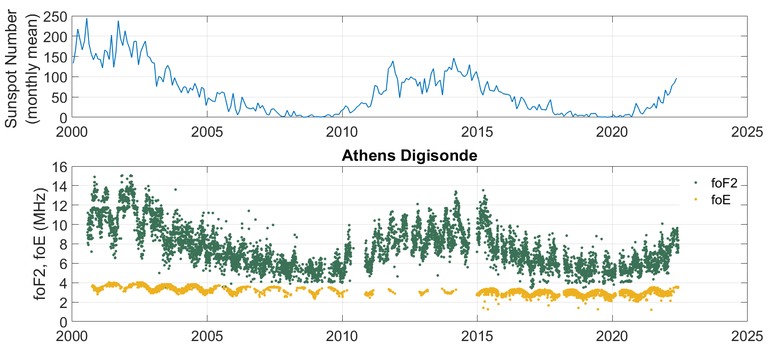
Figure 7. The monthly mean of the sunspot number indicating the solar activity (upper plot). Long duration changes of foF2 and foE parameters measured by the Digisonde at Athens (lower plot).
Sporadic E (Es) layers and their presence on the ionograms
The sporadic E layers are very thin layers of metallic ion plasma situated mainly in the 95-125 km altitude region. They are characterized by a higher electron density than its surroundings and a large horizontal extension. The electron density of the sporadic E layer often exceeds that of the E layer, and in some cases may even be higher than the maximum electron density of the F layer. Therefore, it has a strong influence on radio wave propagation and it is an important part of the ionosphere. The sporadic E layer is present at all latitudes, from the magnetic equator to the polar belts.
The generation of Es layers mainly based on the so called windshear mechanism at mid-latitudes. Wind shear affects the movement of long-lived metallic ions, which leads to the rearrangement of charged particles created by particle and electromagnetic radiation, forming clouds with a higher electron density than their surroundings. Electrons move along the magnetic field lines following the ions according to the Coulomb force, thus maintaining the quasi-neutrality of the plasma. The sporadic E layer can persist also during the night because it consists meteor-derived metal ions that recombine slowly. The plasma density of Es shows both seasonal and diurnal variations at mid-latitudes.
The Es layers appears on the ionograms at the height of the E layer (95-125 km), but with higher plasma density (Figure 8). Its critical frequency related to the maximum electron density is called as foEs parameter. In some cases, the sporadic E layer can obscure the overlying layers (calling blanketing Es layers). Moreover, its plasma frequency can exceed that of the F layer (foEs > foF2).
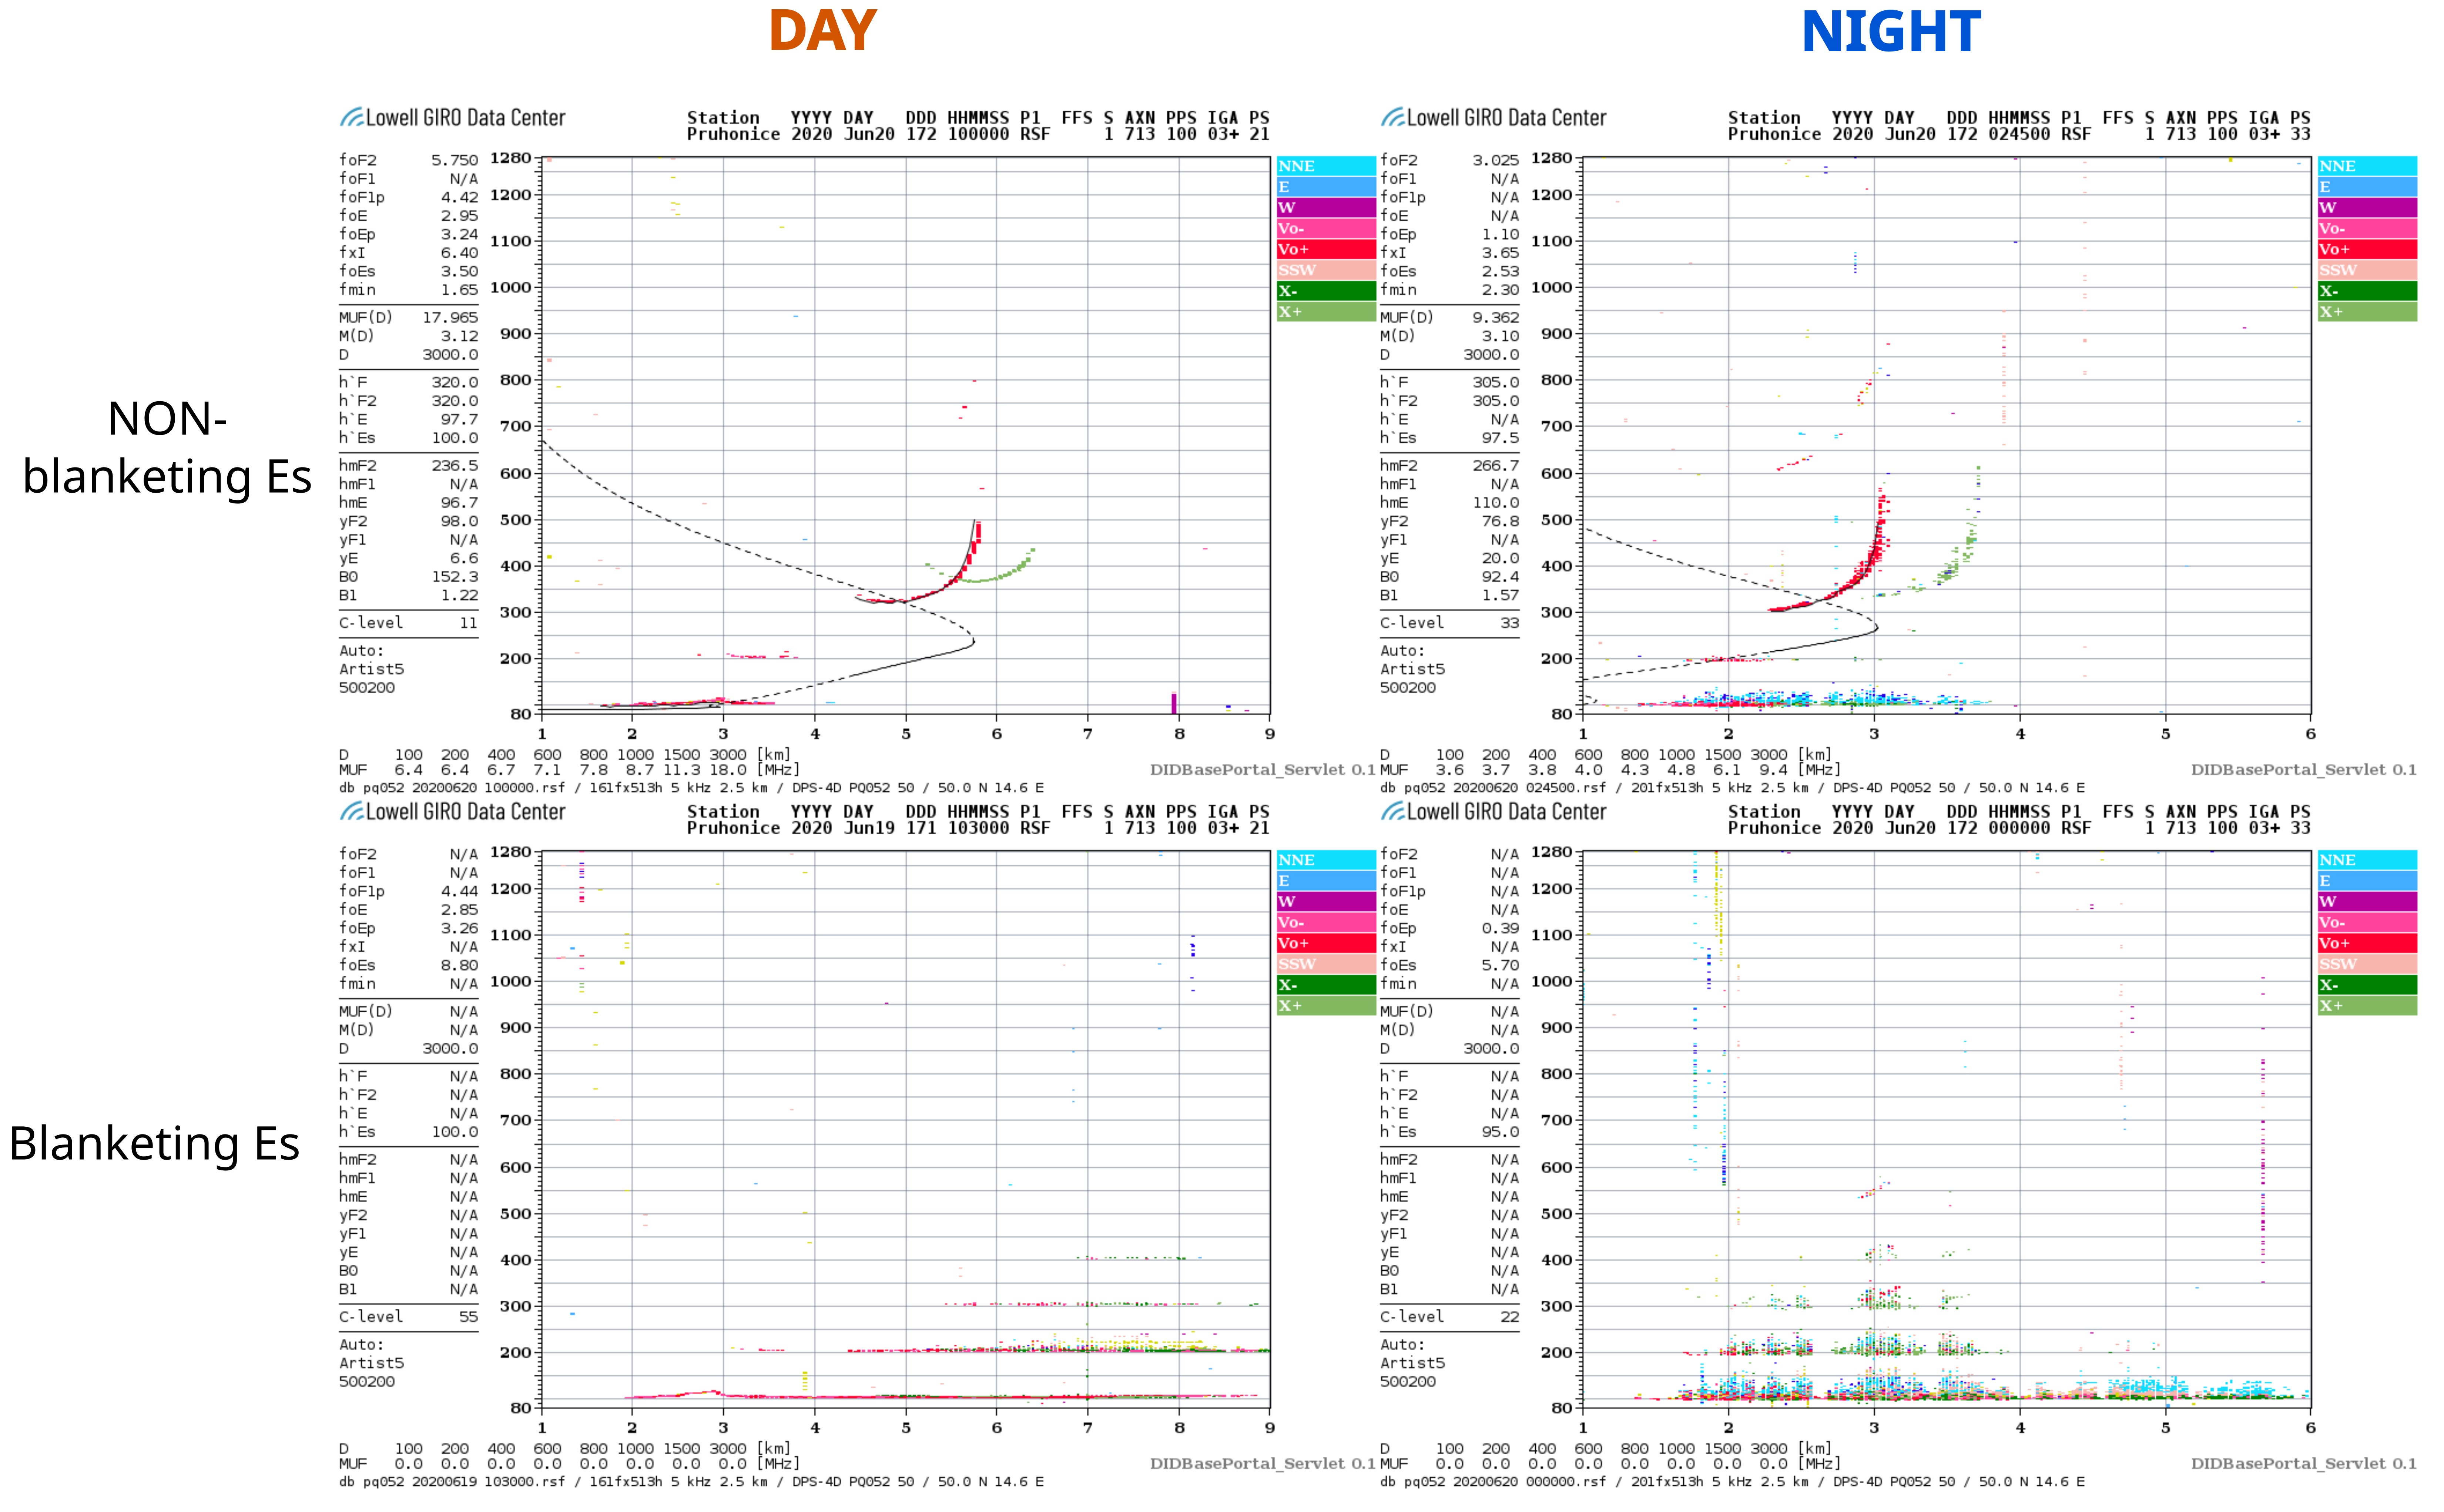
Figure 8. Appearance of blanketing and non-blanketing Es layers on the ionograms.
Travelling Ionospheric Disturbances (TIDs) on the ionograms
Travelling Ionospheric Disturbances (TIDs) are ionospheric disturbances that propagate as waves through the ionosphere disrupting the regular propagation of radioelectrical signals. TIDs can have different sources, from the top, as geomagnetic storms, and from below, as big earthquakes or volcanic eruptions (Figure 9). Based on the different properties such as period, velocity and wavelength, the TIDs can be classified as Medium Scale (MS) and Large Scale (LS) Traveling Ionospheric Disturbances. The typical parameters of the MS- and LSTIDs are shown in Table 1.
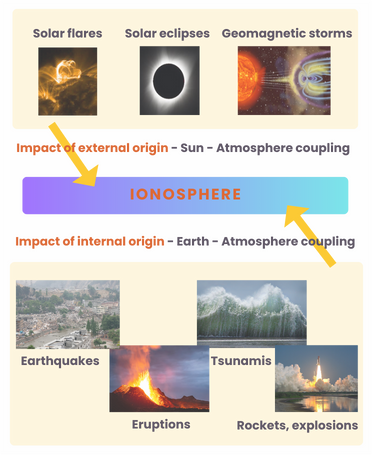
Figure 9. External and internal affects that can generate Traveling Ionospheric Disturbances.
Table 1. Typical properties of medium and large-scale TIDs (source of the table: https://www.sciencedirect.com/topics/earth-and-planetary-sciences/traveling-ionospheric-disturbance)
| Period | VH (m/s) | λH (km) | |
| Medium scale | 10-30 min | 50-300 | 100-300 |
| Large scale | 0.5-5 h | 300-1000 | 300-3000 |
The presence of Medium Scale (MS) Traveling Ionospheric Disturbances can be recognized also on the ionograms. They can appear in different way, such as:
- Y/U-forked F traces in the near of foF2 (Figure 10).
- Satellite traces (ST) – as vertical and/or oblique traces with a slightly higher range parallel to the main ionogram trace (Figure 11).
- Multi cusp signatures (MCS) mainly in the F trace (Figure 12).
- Multi reflection echoes (MRE) (Figure 13).
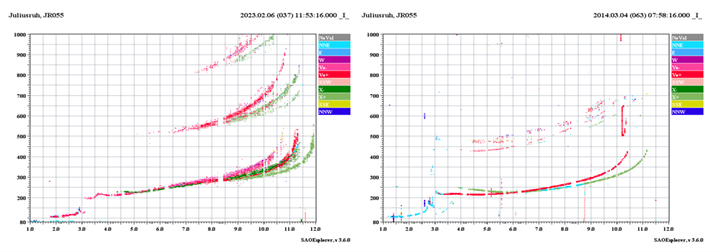
Figure 10. Y/U-forked F traces in the near of foF2 detected at Juliusruh station.
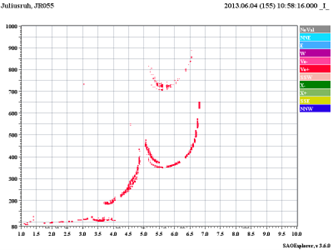
Figure 11. A Satellite trace as an indicator of the TID activity recorded at Juliusruh.

Figure 12. Multi cusp signatures in the F trace measured at Juliusruh.
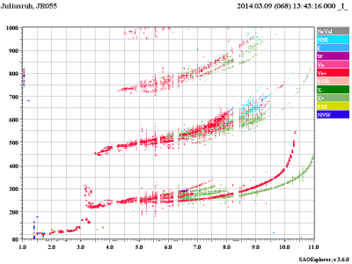
Figure 13. Multi reflection echoes recorded at Juliusruh.
The TID activity can persist for an hour or longer, therefore the above listed signs can appear on more consecutive ionograms. Usually, the Y/U-forked F traces in the near of foF2 appears then the signal is moving down and show up as a satellite trace or multi cusp signature. Here we show an example, the ionograms were recorded at Juliusruh on 23 September 2020 with a 15 min cadence. The presence of the TID activity can be seen during the whole period (06:53-15:03), the above mentioned appearance of the different signatures (it starts as a fork shape on the ionogram, then the signature is moving down and disappear) repeated more times.
Useful links
The ionograms (pictures) can be find at the GIRO (Global Ionosphere Radio Observatory) data base:
https://giro.uml.edu/didbportal/didb-web-portal/
The results of the automatic scaling (critical frequencies, MUFs) are available at:
https://giro.uml.edu/didbase/scaled.php
Further materials, handbooks regarding the scaling of the ionograms:
http://t-fors.eu/t-fors-users/knowledge-hub/handbooks
Participate
You are now able to complete the quiz to assess your comprehension of the Ionosphere!
